What kind of space do you run?
AI-powered Behavioural Analytics for Physical Spaces
Measure how people actually use your space: attention, engagement and movement, beyond the footfall you already count.
Geometry
Every space Constantine measures starts as geometry: the plan, the zones you care about, and the coverage you already have.
- Footprint
The floor as built. Walls, doors and the boundary of the space, taken from the plan you already hold.
345,600
Constantine samples each camera four times a second. Every reading holds where someone is standing, which way they are facing, and how long they have been there. One camera in one gallery produces 345,600 of them in a day, and none of them holds a face.
- Floor position, as a point on your gallery plan.
- Facing, so a pause in front of a work reads differently from a walk past it.
- Dwell, timed from arrival to the moment the visitor moves on.
- Zone and minute, so counts roll up by room and by hour.
Nothing has been filmed here yet.
A 30 to 45 second clip of a gallery goes in this frame once a pilot venue gives us footage we are allowed to show. The marks around it are Constantine's overlay, drawn with nothing under it.
- sample rate
- 4 Hz
- seconds in a day
- 86,400
- readings, one camera
- 345,600
- identities kept
- 0
These are the pipeline's own figures at its 4 Hz sample rate. No venue produced them, and the frame above holds no footage yet.
Your visitor numbers stop at the gallery door.
Ticketing and footfall tell you how many people walked through. They can't tell you which works held attention, which rooms lost it, or where a layout quietly fails. That signal lives in the space itself, and today it goes unrecorded.
- Footfall counts visits and leaves engagement unmeasured.
- Surveys are sparse, late, and self-reported.
- The room's own behaviour is never captured.
Illustration: the same day, with only the entrance track carrying data and every zone track empty and marked unrecorded.
How it Works…
From a camera coverage survey to artwork-level engagement insights:
Integrate, calibrate, measure, and understand visitor attention in real-world space.
Integrate
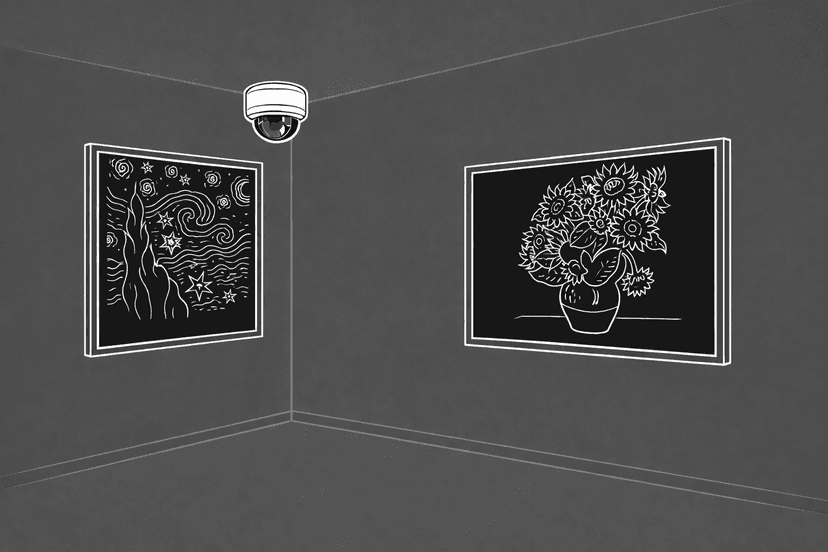
A coverage survey maps your CCTV; standard IP cameras fill any blind spots.
- ✓No facial recognition is used.
- ✓No identity profiles are created.
Each camera simply observes how visitors move and orient within the room.
Calibrate
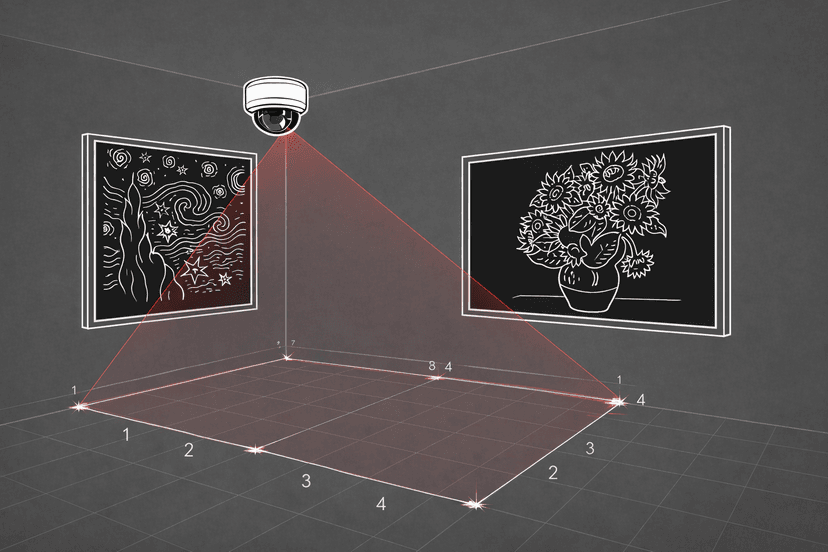
Every gallery is mapped to its real-world dimensions.
This allows Constantine to understand:
- ✓Where artworks are located
- ✓Viewing distances
- ✓Movement patterns between works
- ✓Circulation flow between rooms
Because the room is mapped to its real-world distances, Constantine can build true engagement metrics based on a visitor's position, walking speed and orientation.
Measure
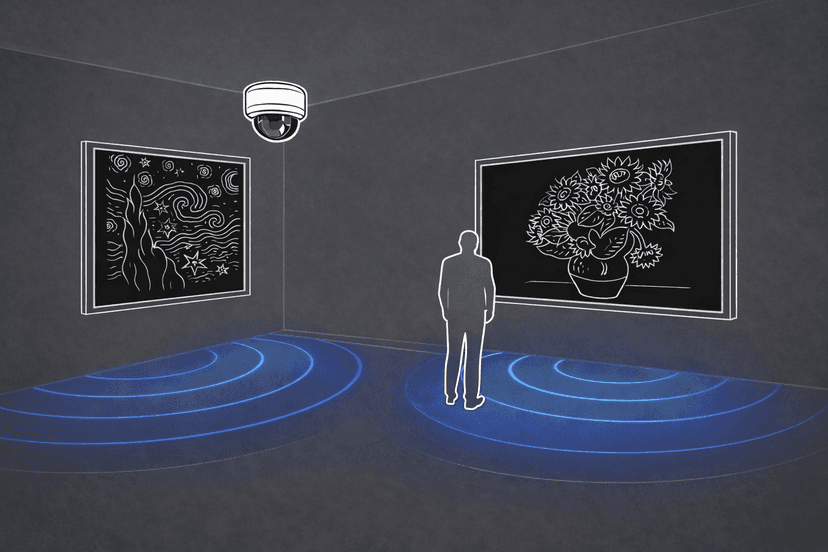
Each artwork is assigned an engagement zone, the space where meaningful attention can occur.
When a visitor enters that zone and orients toward the work, Constantine measures:
- ✓How long attention is sustained
- ✓How frequently visitors return
- ✓How engagement shifts across the exhibition
It captures which works hold attention, and for how long. That is a different question from how many people walked past.
Insight
Curators, directors, analysts and beyond receive real-time analytics and AI-powered recommendations:
- ✓Dwell time distributions per artwork
- ✓Engagement comparisons between rooms
- ✓Visitor flow through the exhibition
- ✓Attention drop-off points
- ✓Engagement patterns by hour/day/week
- ✓AI-powered curation and layout recommendations
All outputs are aggregated and privacy-first.
What you can now answer
Attention, made measurable, so every decision has evidence behind it.
Illustration: a day in a synthetic gallery, one track per zone, every track carrying activity minute by minute with its busiest moment marked.
Which works are actually worth the wall?
See which pieces hold attention and which are walked past, so hangs and loans are evidence-led.
Is the new layout working?
Measure a re-hang or exhibition change against a real before-and-after, so you know whether it worked.
Where do we lose people?
Find the rooms and transitions where engagement drops, and fix the flow.
What do we tell funders?
Turn real engagement into the evidence board reports and grant applications need.
Privacy by design
Constantine is built so that personal data cannot exist in the system. The panel beside this shows the whole of what a camera turns into.
Illustration: three anonymised depth-rendered figures standing in a synthetic gallery. No facial detail is rendered on any of them. A vertical line marks the edge device; the figures dissolve as they reach it, and to its right sits the record that leaves the building, holding a track number, a zone, a dwell time and a facing, with identity, face signature and raw video all recorded as absent.
How does video processing work with Constantine?
All video is processed locally on edge devices inside the venue. The system converts live pixels into anonymous spatial signals (position, orientation, dwell time) in real time. The video stream is never transmitted, never archived, and never accessible to your staff or to Constantine. Once processed, the raw footage is immediately destroyed.
What leaves the device?
Only aggregated, non-identifiable metrics. There is no biometric tracking, no visitor profiles, and no way to reverse-engineer identity from the output. Even Constantine cannot access individual visitor-level tracking data, because it does not exist.
Works with your existing stack
Constantine reads the cameras you already run and writes its metrics into the tools your team already opens.
Cameras and video
ONVIF · RTSP · Axis · Milestone
Warehouse and lake




Databricks · Snowflake · Amazon S3 · BigQuery

on your network
Dashboards and reporting




Power BI · Tableau · Grafana · CSV export
Alerts and workflow



Slack · Microsoft Teams · Webhooks · Email
Every system named here is one Constantine can ingest from or export to, and you configure each connection yourself. None of these companies partners with, certifies or endorses Constantine.
Museum & Gallery Use Cases
From permanent collections to temporary exhibitions and cultural venues. Each card ends in the reading it produces. The readings are illustrative.
Museums & Galleries
Curation insights, layout optimization, donor reporting.
Temporary Exhibitions
Compare rooms, wall-text and label engagement, and A/B layouts.
Cultural Venues
Events, installations, audience flow and crowding.
What lands on your desk
Constantine sends three things into your week: a clean count of who is in each room, a ranked read on what changed, and a short list of things worth doing. Every panel below uses a synthetic gallery and illustrative figures.
Data
Each camera reports the same three things: how many people are in a zone, how long they stay, and which way they face. Counts land minute by minute for every room and every work on the wall.
The footage stays in the building and is destroyed as it is processed. These numbers are the whole of what your dashboard holds.
| Zone | In zone | Median dwell |
|---|---|---|
| North wall | 6 | 41s |
| Centre island | 4 | 22s |
| Doorway | 11 | 6s |
Aggregated counts only. No identity profiles.
Insight
Overnight the counts become a ranking. You see which works held attention this week, which slipped, and how the room reads against the last hang.
Open a row to get the hours behind it, so a curator can check the claim before acting on it.
Action
Monday morning brings a short brief: what changed, what it is costing you in attention, and one thing to try. Each item carries the figures it came from.
Take the brief into a board pack, a grant report, or your own tools through the API.
- 01Move Work 02 off the doorway wallIt holds 19s against a room average of 44s, and the doorway zone turns over every 6s.
- 02Keep the late Thursday openingArrivals peak 40 minutes before close and dwell holds through the last hour.
What buyers ask before a pilot
The four gates a museum team walks us through before saying yes.
Every frame is read on a device inside your museum and destroyed in the same moment. The stream is never uploaded and never archived, so there is no footage library for anyone to request or lose.
No. The system keeps position, orientation and dwell time as anonymous points on a floor plan. There are no faces, no biometric templates and no route back from a metric to a visitor.
A written processing description, a data flow showing which fields leave the device, and the retention position for each one. Your DPO gets something concrete to assess before a camera is touched.
Something we have not covered? Ask it in the pilot request.
Request a pilot
We'll reply with a 15-minute pilot checklist.